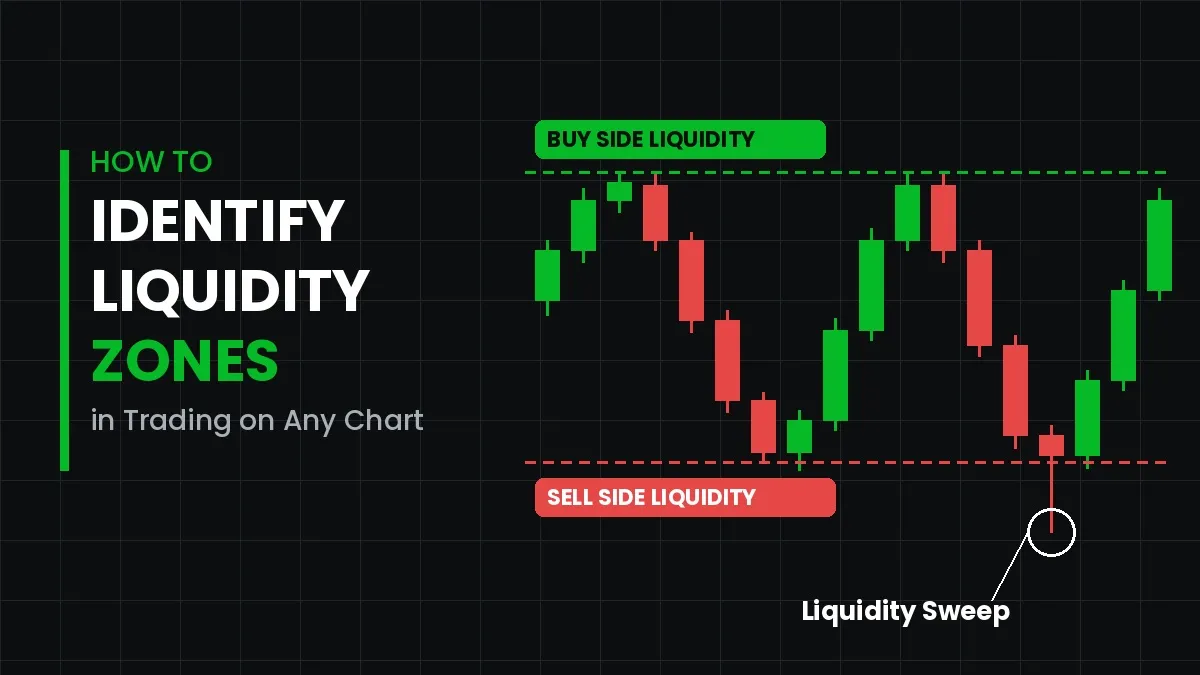
How to Identify Liquidity Zones in Trading on Any Chart
Every price chart tells a story about orders. Some of those orders sit quietly above old highs and below old lows. Others wait at round numbers or near obvious trendlines. Together, they form liquidity zones in trading, and learning to see them can change how you read the market.
After two decades of watching traders learn this skill, one pattern stands out. Most people do not lose because they pick the wrong direction. Instead, they place their entries and stops exactly where everyone else does. As a result, their orders become fuel for larger players.
This guide explains what liquidity zones are and why they form. It also walks you through a simple, repeatable process for spotting them on any chart, whether you trade forex, crypto, stocks, or indices.
What Are Liquidity Zones in Trading?
Liquidity zones in trading are price areas where a large number of pending orders gather. These orders include stop losses, buy stops, sell stops, and limit orders. When price reaches such an area, many orders trigger at once.
Think of it as a pool of available volume. Big participants, such as banks and funds, need that volume to fill large positions. If a fund wants to buy millions of units, it cannot simply click a button. It needs enough sellers on the other side. Clusters of sell stops provide exactly that.
In simple terms, liquidity is the ability to buy or sell without moving price too much. A liquidity zone is where that ability is highest. Therefore, price often moves toward these areas before making its real move.
Why Liquidity Pools Form Where They Do
Retail traders tend to learn the same rules from the same books. For example, most are taught to place a stop just below support or just above resistance. Many also buy breakouts above a clear high. Because so many people follow these habits, orders bunch up at predictable prices.
Human behavior adds another layer. People like round numbers, so stops often sit at levels such as 1.1000 or 50,000. Likewise, traders feel safe placing stops beyond a visible swing point. This shared thinking creates obvious targets on the chart.
Smart money understands this crowd behavior well. Consequently, price is often driven into these pockets of orders. Once the orders are filled, the larger players have the volume they need, and price frequently reverses.
Understanding Buy Side and Sell Side Liquidity
To read any chart properly, you need to separate buy side and sell side liquidity. Each one sits in a different place and serves a different purpose.
Buy Side Liquidity
Buy side liquidity rests above the market. It usually forms above swing highs, equal highs, and resistance levels. Here you will find the stop losses of short sellers. You will also find buy stop orders from breakout traders.
When price rises into this area, those orders turn into market buys. That sudden demand gives large sellers a perfect chance to sell at a premium. For this reason, sharp rejections often appear just above old highs.
Sell Side Liquidity
Sell side liquidity rests below the market. It builds under swing lows, equal lows, and support zones. This is where long traders keep their stop losses. Breakdown traders also park their sell stops here.
When price drops into this zone, those orders become market sells. As a result, large buyers can accumulate positions at a discount. That is why strong bullish reversals often start right after old lows are broken.
Once you understand buy side and sell side liquidity, the chart starts to look different. Highs and lows stop being simple lines. Instead, they become targets that price is likely to visit.
How to Identify Liquidity Zones on Any Chart: Step by Step
The good news is that this process works on every market and timeframe. You only need a clean chart and a little patience. Follow these steps in order.
Step 1: Start With a Higher Timeframe
First, open the daily or 4-hour chart. Higher timeframes show the levels that matter most to large players. Mark the major swing highs and swing lows from the last few weeks. These are your primary liquidity zones in trading.
Step 2: Mark Equal Highs and Equal Lows
Next, look for two or more highs that stop at almost the same price. Do the same for lows. Equal highs and lows look like strong levels to most traders. However, they actually hold a thick layer of stop orders. Because of this, they are some of the most reliable liquidity pools on a chart.
Step 3: Note Previous Day, Week, and Month Levels
After that, draw lines at the previous day high and low. Add the previous week and month levels as well. Many traders and algorithms watch these points closely. Consequently, orders build up around them almost every session.
Step 4: Watch Trendlines and Obvious Patterns
Clean trendlines with three or more touches attract many traders. Stops usually sit just beyond them. The same applies to clear chart patterns, such as triangles and double tops. In short, the more obvious a level looks, the more liquidity it likely holds.
Step 5: Add Round Numbers and Session Ranges
Then, mark nearby psychological levels, such as whole and half numbers. In addition, note the Asian session high and low if you trade forex or indices. These ranges often get cleared during the London or New York open.
Step 6: Confirm With Volume and Price Reaction
Finally, check how price behaved at each level in the past. Long wicks, volume spikes, and fast rejections suggest that orders were filled there. Levels that have not been touched yet are often more attractive targets. Over time, you will learn which zones deserve the most attention.
What Is a Liquidity Sweep?
A liquidity sweep happens when price briefly pushes beyond a key high or low and then quickly returns. The move triggers the resting stops, collects the orders, and then reverses. Many traders call this a stop hunt or a false breakout.
For example, imagine a pair has formed equal lows at 1.0850. Price drops to 1.0835, hits the sell stops, and closes back above 1.0850 within a few candles. That quick dip is a classic liquidity sweep. Shortly after, price often rallies toward the opposite side of the range.
How to Spot a Liquidity Sweep
A few clues help you separate a sweep from a real breakout:
- Long wick beyond the level. The candle pokes through the high or low but closes back inside the range.
- Fast rejection. Price returns within one to three candles instead of holding outside the level.
- Shift in structure. On a lower timeframe, price breaks a recent swing point in the opposite direction.
- Volume spike. A burst of volume often appears as the stops are triggered.
In contrast, a true breakout usually closes firmly beyond the level. It also holds there and builds new structure. Therefore, waiting for the candle close is one of the simplest ways to avoid being trapped.
Using a Liquidity Sweep in Your Analysis
A liquidity sweep is not an entry signal on its own. Rather, it is a sign that the market may be ready to reverse. Experienced traders wait for confirmation, such as a lower timeframe structure shift. They then look for a pullback into a fair value gap or order block before acting. Stops are placed beyond the wick of the sweep, which gives the trade a clear point of invalidation.
Common Mistakes When Trading Liquidity Zones
Even skilled traders misread these areas at times. Here are the errors I see most often, along with simple fixes.
Marking too many levels. A chart covered in lines creates confusion rather than clarity. Instead, focus on the clearest highs, lows, and equal levels on your main timeframe.
Trading every touch. Not every visit to a zone leads to a reversal. Sometimes price breaks through and keeps going. That is why confirmation matters more than the level itself.
Ignoring the bigger trend. A sweep of lows in a strong downtrend may only offer a small bounce. Meanwhile, the same sweep in an uptrend can start a major rally. Always check which direction the higher timeframe favors.
Placing stops in the obvious spot. If your stop sits right under equal lows, it becomes part of the pool. Consider giving it more room beyond the likely sweep area, and adjust your position size to match.
Skipping risk management. No method works every time. Risking a small, fixed percentage per trade keeps one mistake from damaging your account. Keeping a trading journal also helps you learn which zones work best for you.
Putting It All Together
A simple routine keeps this approach consistent. Begin each session by marking higher timeframe highs and lows. Then add equal levels, previous day ranges, and round numbers. Next, decide which side of the market holds the most obvious pool of orders. Finally, wait for price to reach that area and watch how it reacts.
With practice, you will notice that price rarely moves in a straight line. Instead, it travels from one pool of orders to the next. Once you see the market this way, many confusing moves begin to make sense.
Final Thoughts
Learning to read liquidity zones in trading is less about prediction and more about understanding where orders sit. When you can map buy side and sell side liquidity, you start to see why price moves the way it does. Spotting a liquidity sweep then becomes a matter of patience and confirmation, not guesswork. Above all, combine these ideas with sound risk management and honest review of your trades.
Many traders who study liquidity also look for tools that help them stay objective, and a common question they search is "is GainzAlgo legit" before trying any charting aid. GainzAlgo is one of the platforms traders review for this purpose, and the sensible approach with any tool is the same: test it on a demo account, compare its signals with your own liquidity analysis, and judge it on results over time rather than claims.


About Premium Author
This post has been authored and published by one of our premium contributors, who are experts in their fields. They bring high-quality, well-researched content that adds significant value to our platform.
.png)